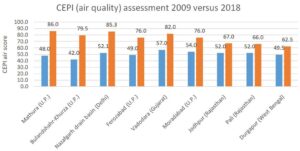
Recently, researchers at Centre for Science and Environment (CSE) analysed the 2018 Comprehensive Environmental Pollution Index (CEPI) air assessment score that depicts the air quality in industrial regions.
Key findings
- As per the analysis of CSE, Uttar Pradesh and Maharashtra had the greatest number of ‘critically polluted’ industrial regions in India
- CSE researchers have found out that as many as 13 industrial areas in UP, seven in Maharashtra, eight in Gujarat and five in Rajasthan were still critically / severely polluted with respect to the 2009 air quality levels in these regions.
- Mathura, Bulandshahr, Firozabad, Moradabad in Uttar Pradesh; Chandrapur and Tarapur in Maharashtra; Vadodara and Ankleshwar in Gujarat; Jodhpur and Bhiwadi in Rajasthan were found to be the top critically polluted regions with a high CEPI air score.
States with a considerable number of critically / severely polluted air quality regions
A CEPI air score of 60 and above denotes an industrial area to be ‘critically polluted’ and a score between 50-60 classifies it to be ‘severely polluted’.
| State | Number of industrial clusters identified as critically / severely polluted | Critically polluted (air quality) | Severely polluted (air quality) |
| CEPI 2018 (air) score >=60 | CEPI 2018 (air) score: between 50-60 | ||
| Uttar Pradesh | 13 | Mathura, Bulandshahr-Khurja, Ferozabad, Moradabad, Gajraula, Varanasi-Mirzapur, Kanpur, Agra | Noida, Ghaziabad, Aligarh, Meerut, Haridwar |
| Gujarat | 8 | Vadodara, Ankleshwar, Vapi, Bhavnagar | Vatva, Ahmedabad, Rajkot, Morbi |
| Maharashtra | 7 | Chandrapur, Tarapur, Dombivalli, Nashik, Navi-Mumbai, Chembur, Pimpri-Chinchwad | – |
| Rajasthan | 5 | Jodhpur, Bhiwadi, Pali, Sanganer Industrial Area, Jaipur | – |
| West Bengal | 4 | Howrah, Durgapur | Bandel, Asansol |
| Haryana | 3 | Gurugram, Panipat | Faridabad |
| Jharkhand | 5 | Hazaribagh | Saraikela, Ramgarh, Singhbum-Wet, Bada Jamtara |
Top regions with worsening air quality: A comparison of 2009 and 2018 CEPI air score
- CSE also compared the latest 2018 assessment scores for air with the 2009 scores.They have found out that from the 2009 levels, air quality had worsened in several industrial clusters.
- The majority of these industrial regions belong to Uttar Pradesh.
- A drastic increase in CEPI air scores was observed in Mathura, Bulandshahr, Moradabad and Firozabad in Uttar Pradesh, Najafgarh drain basin in Delhi comprising of Anand-Parvat, Naraina, Okhla and Wazirpur areas, Vadodara in Gujarat, Jodhpur and Pali in Rajasthan and Durgapur in West Bengal.

About CEPI Index
- It is a nationwide index that was developed to represent the quality of ambient air, surface water, groundwater and soil of a particular industrial region or cluster with a score.
- Calculation of score: The CEPI score was calculated based on the individual score assessment for air pollution, surface water pollution, groundwater and soil pollution in the identified cluster.
- Classification of regions: The regions were ranked as ‘critically polluted area’, ‘severely polluted area’ and ‘other polluted areas’, depending upon the CEPI scores of each of these industrial areas.
- A CEPI air score of 60 and above denotes an industrial area to be ‘critically polluted’ and a score between 50-60 classifies it to be ‘severely polluted’ with respect to air quality.
- Previous assessment: CEPI assessment was first carried out by CPCB in 2009-10 and has been done periodically since then in 2011, 2013 and 2018.
- The aim of CEPI assessment was to identify, declare and prioritize critically polluted and severely polluted regions in order to formulate comprehensive remedial action plans for pollution abatement in identified regions.
- The CEPI assessment reflects the current environmental quality of the region and also serves as a yardstick to assess the implementation of action plans.
The concept of Comprehensive Environmental Pollution Index (CEPI)
- It was evolved by Central Pollution Control Board (CPCB) during 2009-10 as a tool for comprehensive environmental assessment of prominent industrial clusters and formulation of remedial Action Plans for the identified critically polluted areas.
- CPCB has done a nation wide environmental assessment of Industrial Clusters based on CEPI and 43 such industrial clusters having CEPI greater than 70, on a scale of 0 to 100, has been identified as critically polluted.
- The data refers to the Comprehensive Environmental Pollution Index (CEPI) scores of the critically polluted industrial clusters/areas. The index captures the various dimensions of environment including air, water and land.
- CEPI which is a rational number to characterize the environmental quality at a given location following the algorithm of source, pathway and receptor have been developed


