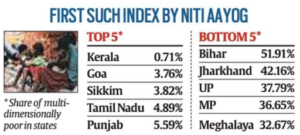
In news- NITI Aayog has released the first ever National Multidimensional Poverty Index (NMPI) recently.
Key highlights of the index-
- It was developed by the NITI Aayog in consultation with 12 ministries and in partnership with state governments and the index publishing agencies, namely, Oxford University’s Oxford Poverty and Human Development Initiative (OPHI) and United Nations Development Programme (UNDP).
- The National MPI Project is aimed at deconstructing the Global MPI and creating a globally aligned and yet customised India MPI for drawing up comprehensive Reform Action Plans with the larger goal of improving India’s position in the Global MPI rankings.
- It is calculated using the household microdata collected at the unit-level for the NFHS-4 (which was conducted between 2015 and 2016) that is used to derive the baseline multidimensional poverty.
- NFHS is conducted by the International Institute for Population Sciences (IIPS) under the Ministry of Health and Family Welfare.
- The Index is calculated using 12 indicators – nutrition, child and adolescent mortality, antenatal care, years of schooling, school attendance, cooking fuel, sanitation, drinking water, electricity, housing, assets and bank account that have been grouped under three dimensions namely, health, education and standard of living.
- According to Global MPI 2021, India’s rank is 66 out of 109 countries.
- The NMPI enables estimation of poverty not only at the level of the states but also for all the 700-plus districts across the 12 indicators, capturing simultaneous deprivations and indicator-wise contribution to poverty.
- As per NMPI, Bihar also has the highest number of malnourished people followed by Jharkhand, Madhya Pradesh, Uttar Pradesh, and Chhattisgarh.
- Kerala, Goa, and Sikkim have the lowest percentage of population being multidimensionally poor at 0.71 per cent, 3.76 percent and 3.82 per cent, respectively.
- Among the Union Territories (UTs), Dadra and Nagar Haveli (27.36 per cent), Jammu & Kashmir, and Ladakh (12.58), Daman & Diu (6.82 per cent) and Chandigarh (5.97 per cent), have emerged as the poorest UTs in India.
- The proportion of poor in Puducherry at 1.72 percent is the lowest among the Union Territories, followed by Lakshadweep at 1.82 per cent, Andaman & Nicobar Islands at 4.30 per cent and Delhi at 4.79 percent.


