- The combined (Centre and States) social sector expenditure as % of GDP has increased in 2020-21 compared to last year.
- India’s rank in HDI 2019 was recorded at 131, out of a total 189 countries:
- India’s GNI per capita (2017 PPP $) has increased from US$ 6,427 in 2018 to US$ 6,681 in 2019
- Life expectancy at birth improved from 69.4 years in 2018 to 69.7 years in 2019
- The access to data network, electronic devices such as computer, laptop, smartphone etc. gained importance due to online learning and remote working during the pandemic
- Major proportion of workforce engaged as regular wage/salaried in the urban sector during the period of January 2019-March 2020 (quarterly survey of PLFS)
- Government’s incentive to boost employment through Atma Nirbhar Bharat Rozgar Yojana and rationalization and simplification of existing labour codes into 4 codes
- Low level of female LFPR in India:
- Females spending disproportionately more time on unpaid domestic and caregiving services to household members as compared to their male counterparts (Time Use Survey, 2019)
- Need to promote non-discriminatory practices at the workplace like pay and career progression, improve work incentives, including other medical and social security benefits for female workers
- Under PMGKP announced in March, 2020, cash transfers of upto Rs.1000 to existing old aged, widowed and disabled beneficiaries under the National Social Assistance Programme (NSAP)
- An amount of Rs. 500 each was transferred for three months digitally into bank accounts of the women beneficiaries under PM Jan Dhan Yojana, totalling about Rs. 20.64 crores
- Free distribution of gas cylinders to about 8 crore families for three months
- Limit of collateral free lending increased from Rs. 10 lakhs to Rs. 20 lakhs for 63 lakh women SHGs which would support 6.85 crore households
- Wages under Mahatma Gandhi NREGA increased by Rs.20 from Rs.182 to Rs.202 w.e.f. 1st April, 2020

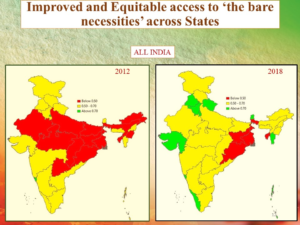
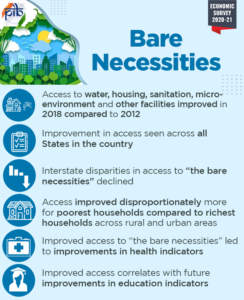
- Access to the ‘bare necessities’ has improved across all States in the country in 2018 as compared to 2012
- It is highest in States such as Kerala, Punjab, Haryana and Gujarat while lowest in Odisha, Jharkhand, West Bengal and Tripura
- Improvement in each of the five dimensions viz., access to water, housing, sanitation, micro-environment and other facilities
- Inter-State disparities declined across rural and urban areas as the laggard states have gained relatively more between 2012 and 2018
- Improved disproportionately more for the poorest households when compared to the richest households across rural and urban areas
- Improved access to the ‘bare necessities’ has led to improvements in health indicators such as infant mortality and under-5 mortality rate and also correlates with future improvements in education indicators

- Thrust should be given to reduce variation in the access to bare necessities across states, between rural and urban and between income groups
- The schemes such as Jal Jeevan Mission, SBM-G, PMAY-G, etc. may design appropriate strategy to reduce these gaps
- A Bare Necessities Index (BNI) based on the large annual household survey data can be constructed using suitable indicators and methodology at district level for all/targeted districts to assess the progress on access to bare necessities.
Source: PIB & Economic Survey


